Designed an innovative 0→1 enterprise product that translated complex quantitative data into confident decision-making — licensed by two major North American brokers within two months of launch (validated market fit).
Problem
Options trading platforms were overly complex, intimidating, and built primarily for advanced users. There was no simple, intuitive product on the market that translated sophisticated analytics into accessible insights.
This gap represented a strategic opportunity: by creating a streamlined, user-friendly solution, the company could differentiate from competitors and gain a meaningful competitive advantage.
Goal
Design a simplified yet powerful options analysis experience that increases user confidence and engagement, supports rapid market launch within 12 months, and validates a new revenue opportunity for the business.
My Role and Approach
As Lead Product Designer, I owned the end-to-end UX process, ensuring design decisions aligned with business objectives. To inform the direction, I combined previous user research with newly conducted in-house interviews, netnography, and competitive analysis. I found that:
Most novice options traders have solid financial backgrounds.
Traders seek tools aligned with their diverse strategies.
Investors desire educational content to build confidence.


Stage 1: Strategy Lab
Leveraging research findings, we build a feature that empowers novice options investors by providing a guided, personalized approach to options trading. Through an intuitive 4-step questionnaire that assesses trading preferences and risk tolerance, users are presented with tailored options strategies that align with their individual investment profile.
After 4 iterations — shaped by usability testing and stakeholder feedback — here's where we landed.

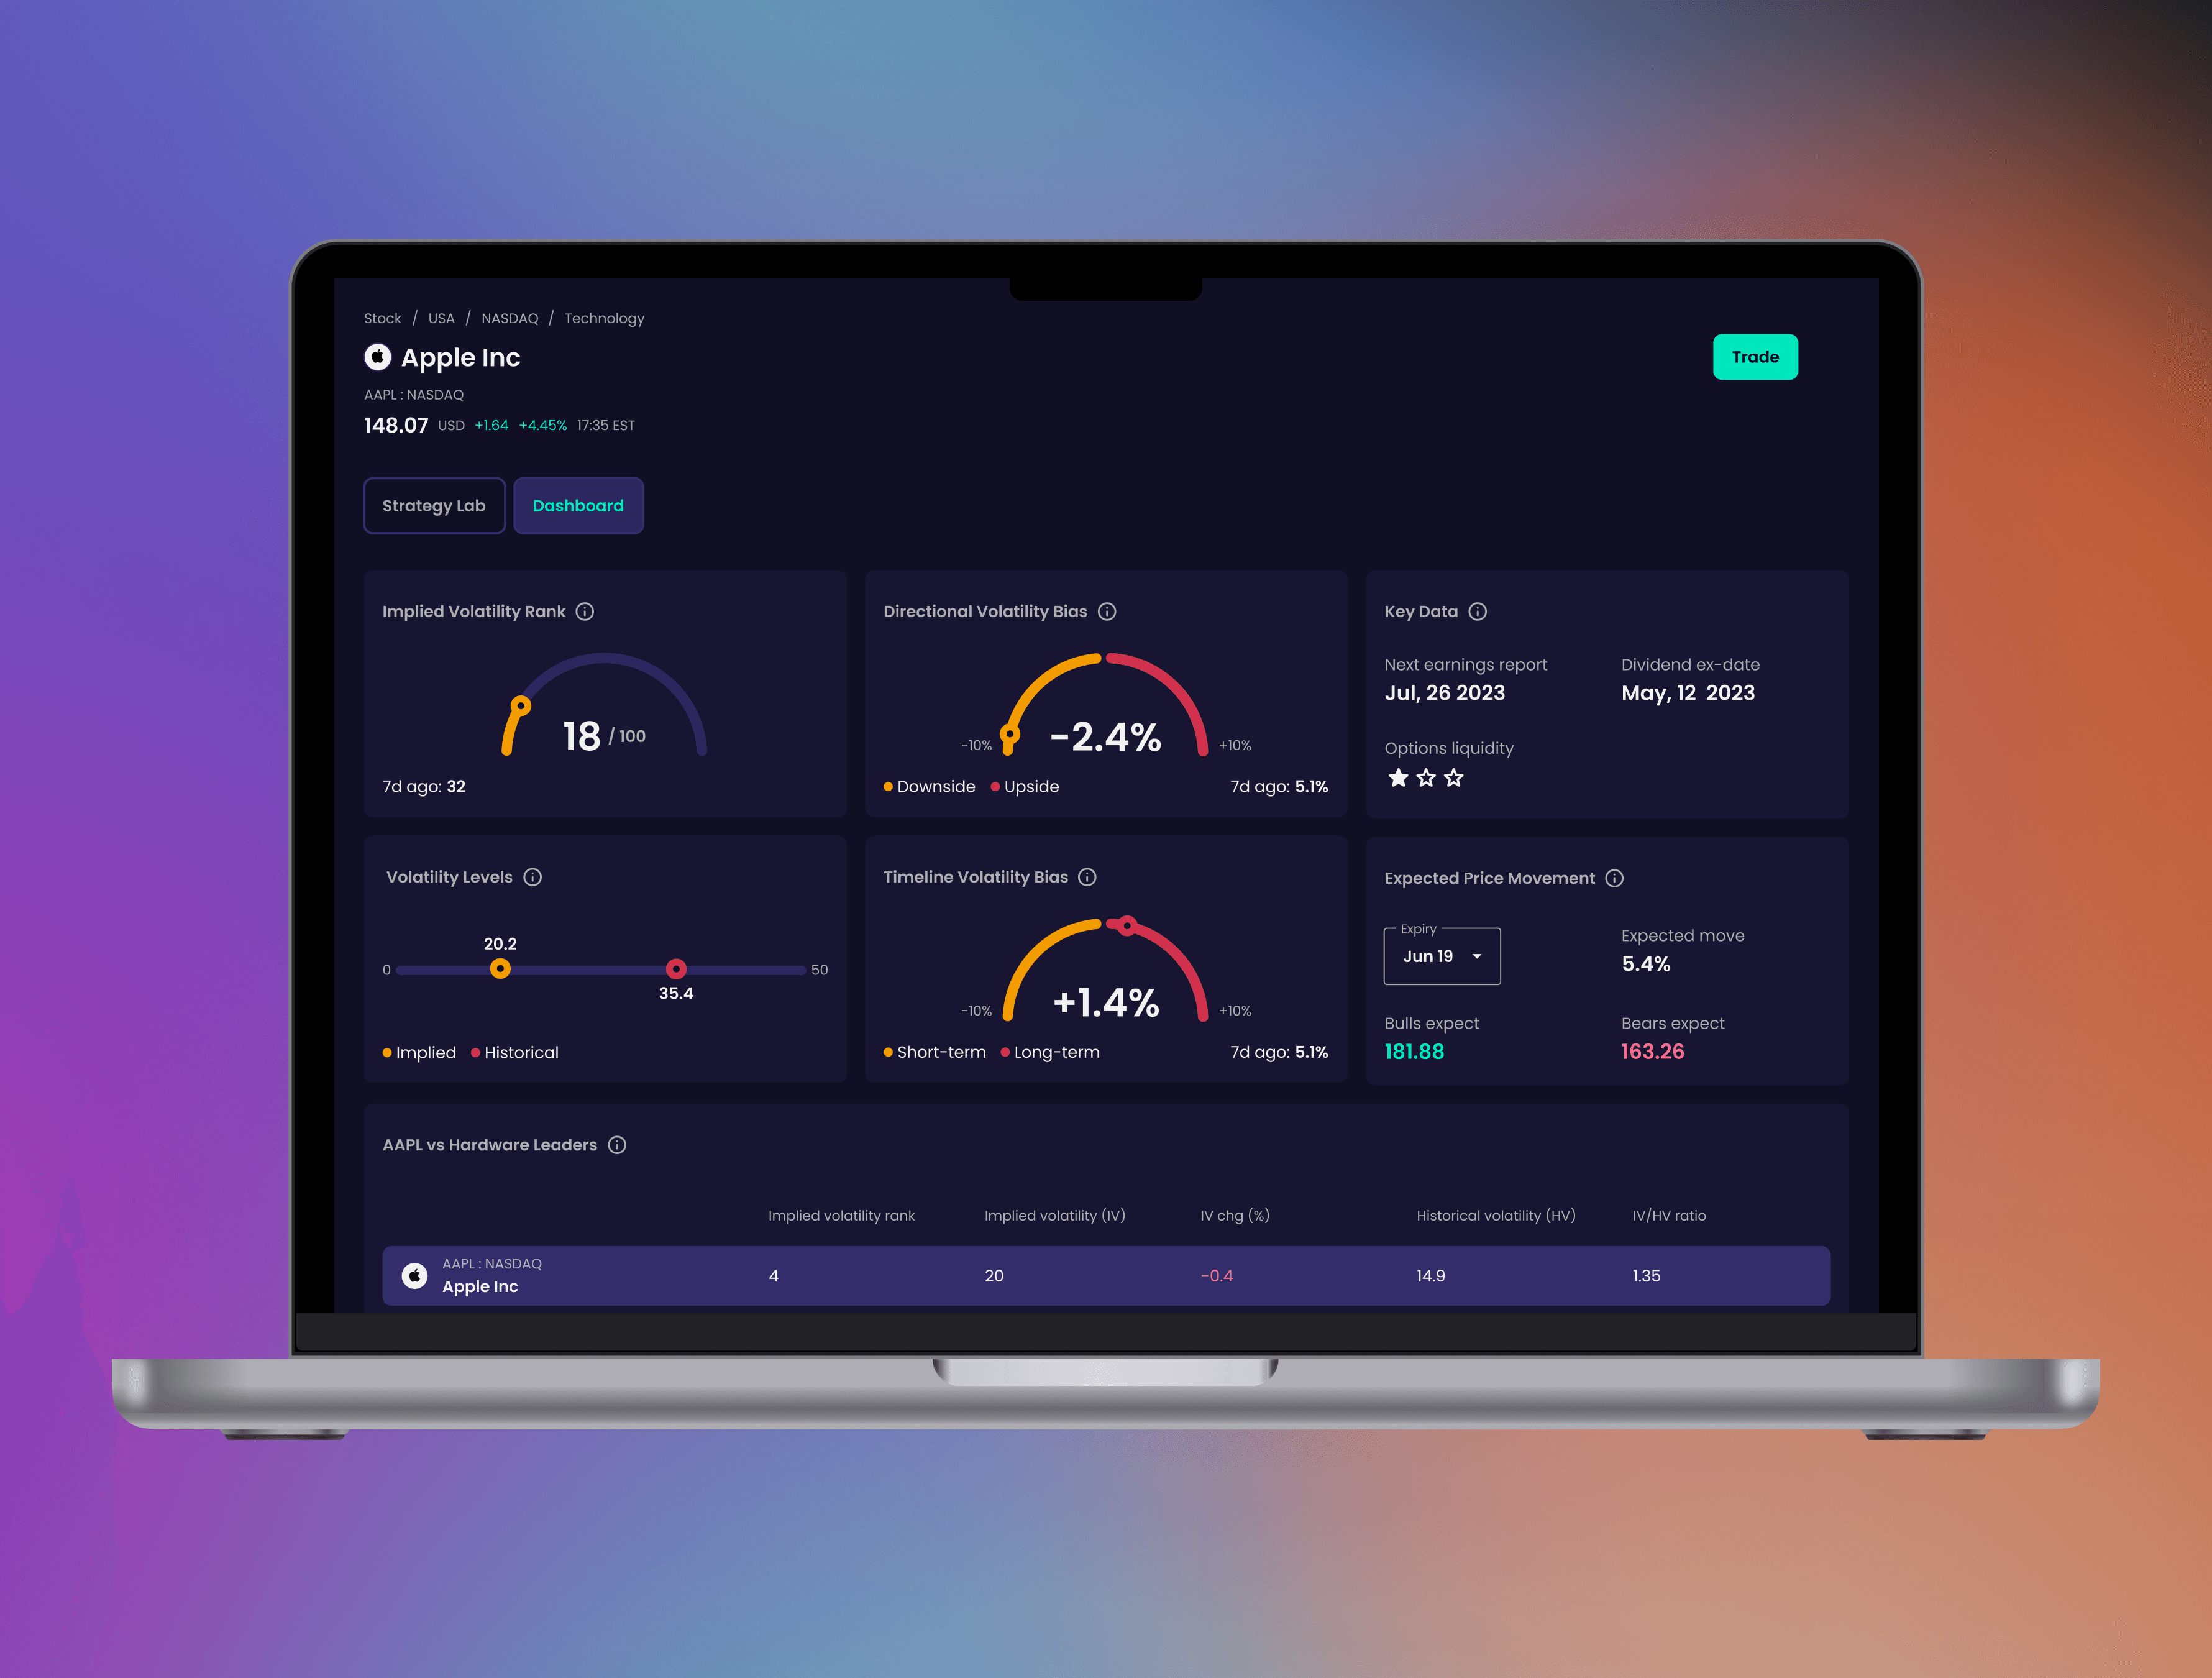
Stage 2: Options Dashboard
Options data often appears as complex tables filled with numbers, which can be overwhelming for beginner options traders.
By collaborating with financial analysts, we identified key data points that influence buying or selling decisions and transformed them into intuitive visualizations.


Stage 2: Options Dashboard
Options Dashboard supports Strategy Lab by providing additional information on whether buying or selling options contracts or strategies of a specific stock is a viable idea.
The team and I went through 3 dashboard versions, informed by usability testing and stakeholder feedback.

Challenges
Tight Deadlines: Each feature had to be completed within a strict 6-month timeframe, which pushed us to work efficiently and prioritize effectively within the agile framework.
Changing Data Providers: Several changes in data providers required us to continuously redesign the product, testing our ability to adapt quickly.
Knowledge Gaps: Most team members had limited to no knowledge of options trading, which created a learning curve for everyone involved.
Visualizing Complex Data: We needed to translate complex options terminology and data into clear, easy-to-understand visualizations - quite a task when you’re new to options yourself.
Results
Validated Market Fit: Successfully secured licenses from two brokers, confirming the product's value and market potential.
Next Steps
Post-launch testing: Conducting further usability tests to ensure accessibility standards as well as users’ goals & needs are met.
Expanding features: Creating an educational platform that provides easy-to-understand content to help investors of all levels make informed decisions.
Post-mortem analysis: This project has taught us to involve stakeholder at every major design step to make sure our goals and expectations are aligned & plan ahead as much as possible.

©2026 Maria Gogoleva
GO BACK TO TOP